Prefill vs. Decode: Why the Second Token Is a Different Workload
On the same GPU, with the same weights, Qwen3-8B reads a 2,048-token prompt at 0.20 milliseconds per token and writes its answer at 74 milliseconds per token: each answer token costs 370 times more than a prompt token. Decode is not doing more work per pass; it is doing 2,048 times less, and that is the problem. We traced both phases in vLLM down to the GPU kernels to show where the time goes.
Two phases, one model
Every request has two phases (followed stage by stage here). Prefill runs the whole prompt through the model in one forward pass, writes the prompt's keys and values into the KV cache, and produces the first answer token. Decode then produces the rest of the answer, one token per forward pass, each pass reading the KV cache instead of recomputing the prompt.
Both phases run the same layers with the same weights. What differs is how many tokens go through those weights at once: thousands in prefill, one per request in decode. That single difference changes which kernels run and what limits them.
The same layer, two shapes
Take one linear layer of Qwen3-8B: the merged gate and up projection of a transformer block, a 4,096 × 24,576 weight matrix, 201 MB in BF16. A forward pass multiplies the tokens' activations (one row of 4,096 numbers per token) by that matrix.
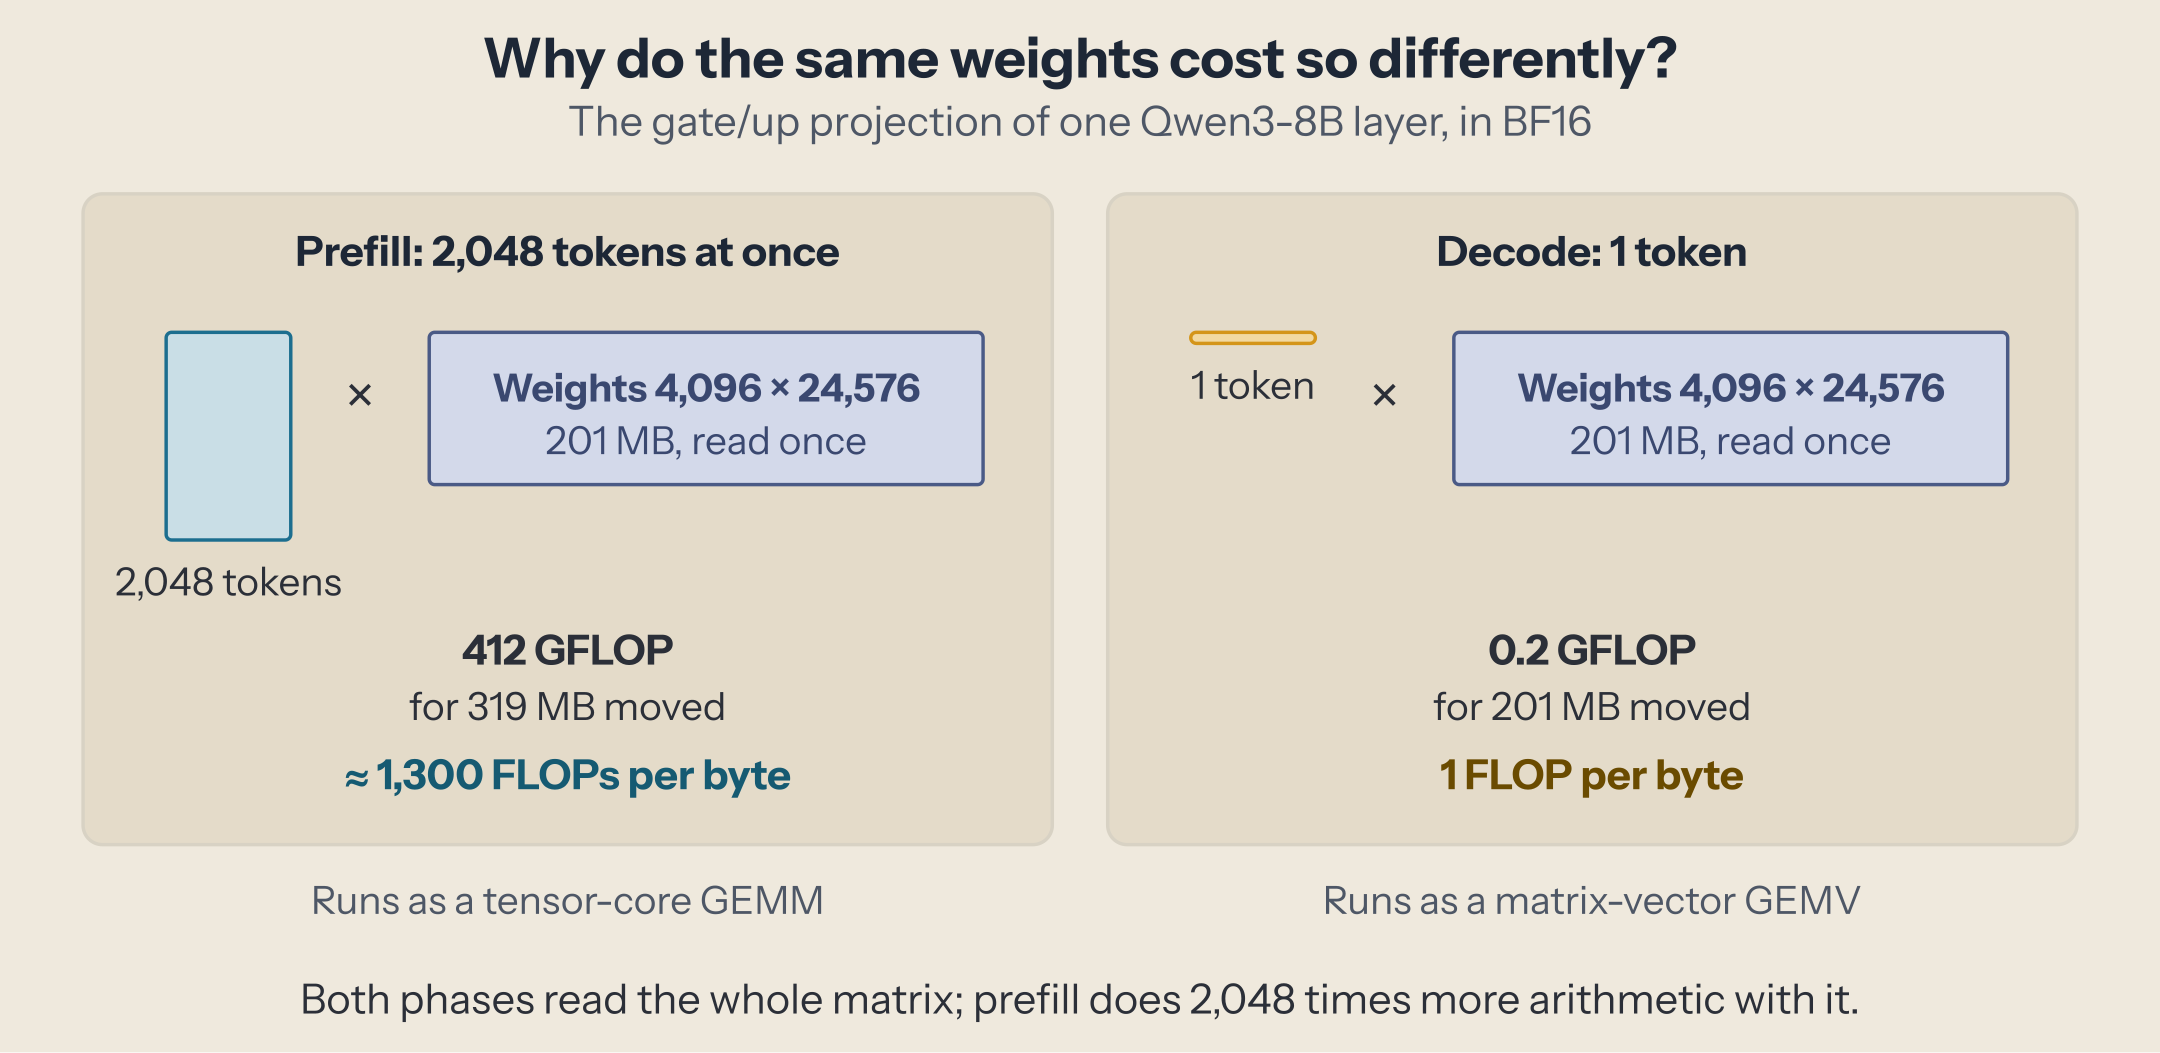
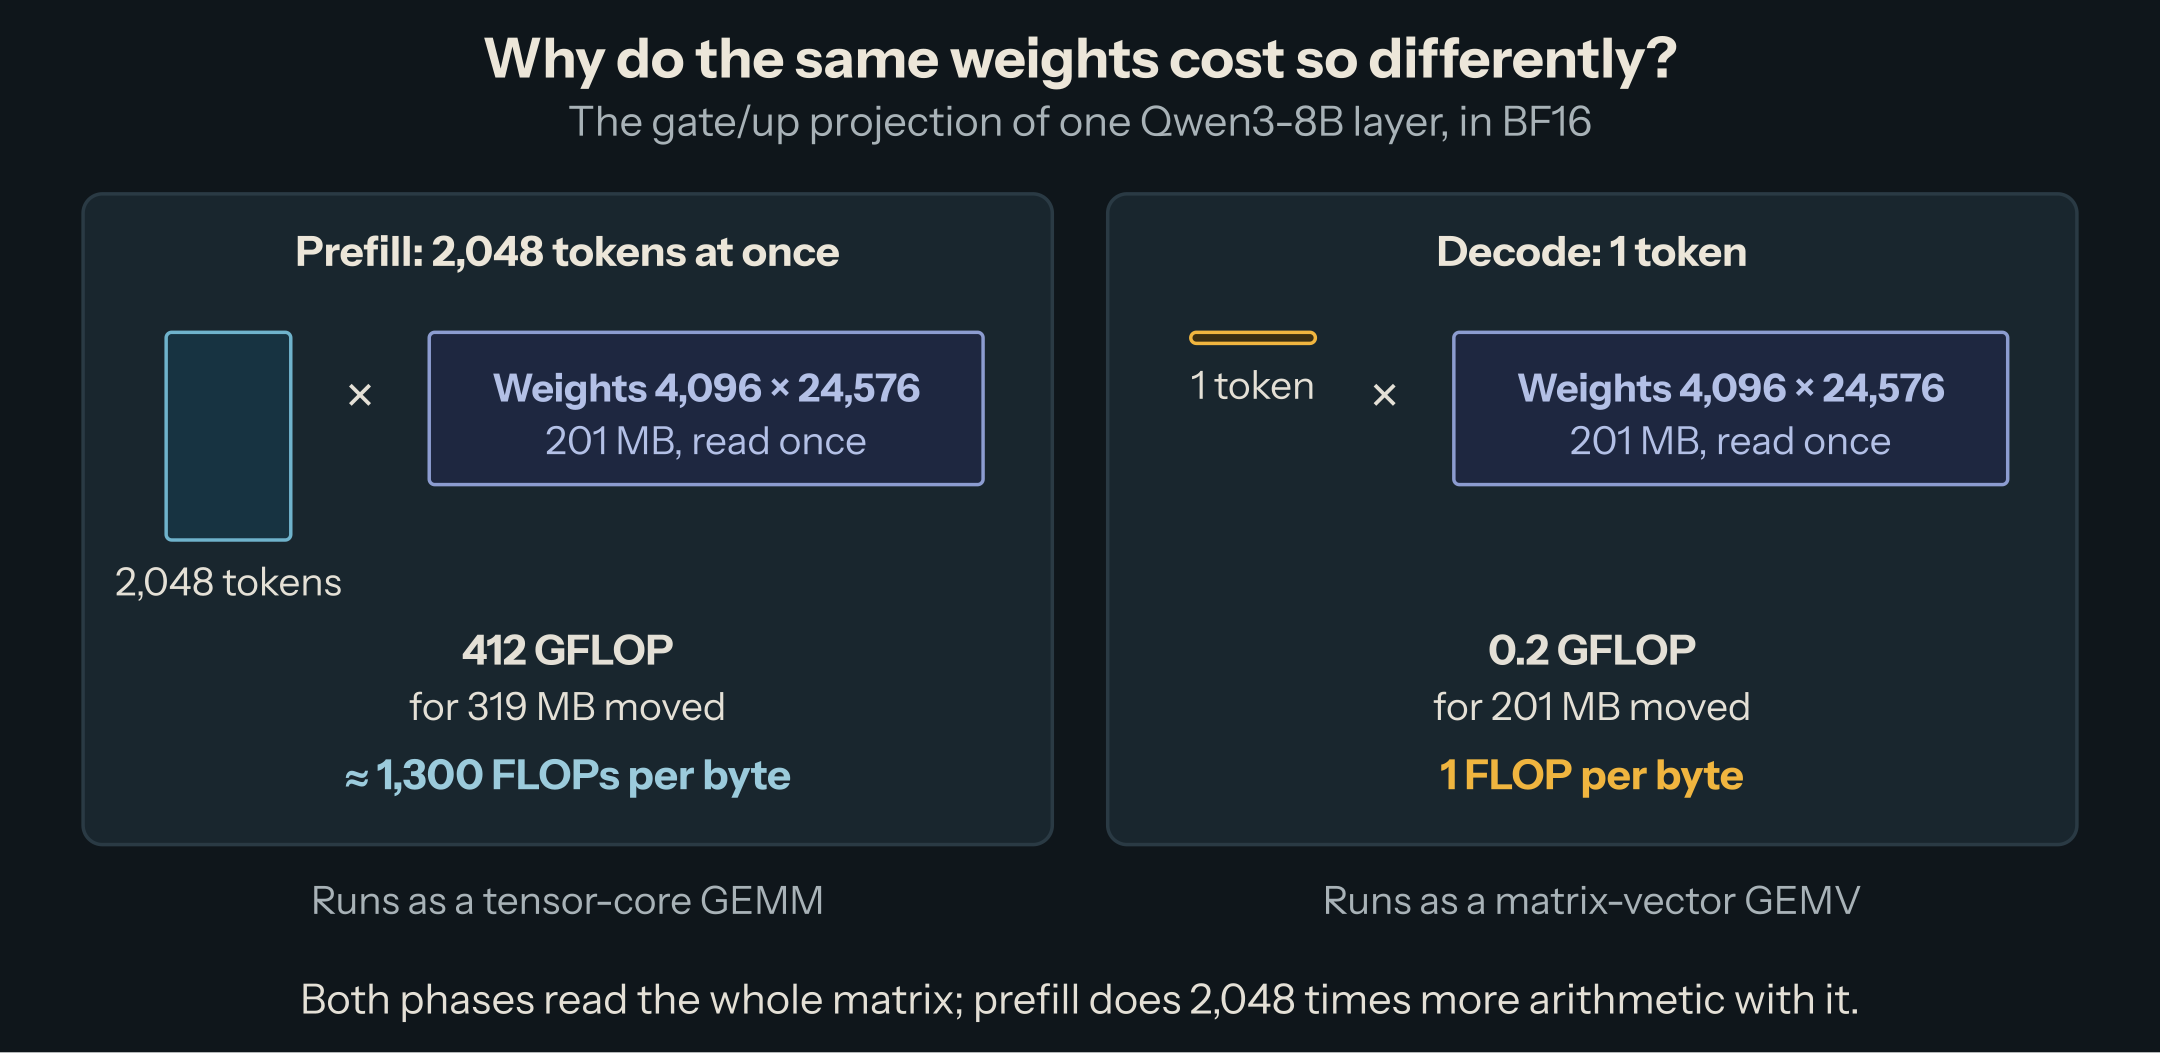
In prefill, 2,048 rows go through the matrix at once: a matrix-matrix product (GEMM). It does 2 × 2,048 × 4,096 × 24,576 = 412 billion floating-point operations and moves 319 MB (the weights once, plus the activations in and out): about 1,300 operations per byte. The GPU's tensor cores can do hundreds of operations in the time it takes to read one byte from memory, so this product is limited by arithmetic.
In decode, one row goes through the same matrix: a matrix-vector product (GEMV). It does 0.2 billion operations and still reads all 201 MB: one operation per byte. The arithmetic units finish their share almost instantly and wait for the weights to stream in. The time is set by memory bandwidth.
Every linear layer of the model follows this pattern, and the linear layers hold nearly all of the model's weights. So what separates the two phases is how many tokens share one read of the weights: a batch of 32 decoding requests gets the same benefit as a 32-token prompt. The roofline piece turns this into a general rule with the GPU's two limits; here we look at what the engine actually runs.
What the trace shows
We ran vLLM 0.31.0 with Qwen3-8B in BF16 on an NVIDIA GB10 under Nsight Systems, NVIDIA's timeline profiler, with prefix caching off: one 2,048-token prompt asked for 1 output token (prefill only), then the same prompt for 65 (prefill plus 64 decode steps). Each run sat in its own NVTX range (a named span on the profiler's timeline), so the kernel time of the second minus the first is what 64 decode steps cost, to within a few milliseconds.
$ mkdir -p out
$ VLLM_ENABLE_V1_MULTIPROCESSING=0 nsys profile -t cuda,nvtx --cuda-graph-trace=node -o pd \
    python pd_trace.py out 64
$ nsys stats -r cuda_gpu_kern_sum --filter-nvtx prefill-only pd.nsys-rep
$ nsys stats -r cuda_gpu_kern_sum --filter-nvtx prefill+decode pd.nsys-rep
VLLM_ENABLE_V1_MULTIPROCESSING=0 keeps vLLM's engine in the profiled process, so the NVTX ranges and the kernels are on the same timeline; --cuda-graph-trace=node shows the kernels inside CUDA graphs (recorded sequences of kernels replayed with one launch), which vLLM uses for decode. The heart of pd_trace.py is a few lines around vLLM's LLM class; each shape is warmed up first, timed five times, and the last run is wrapped in the NVTX range:
# scripts/gx10/pd_trace.py (simplified: warm-up and the five timed runs omitted)
llm = LLM("Qwen/Qwen3-8B", gpu_memory_utilization=0.85, max_model_len=8192,
          enable_prefix_caching=False, max_num_batched_tokens=8192, seed=0)
ids = llm.get_tokenizer()(text)["input_ids"][:2048]   # any 2,048 tokens
prompt = {"prompt_token_ids": ids}
for n, label in ((1, "prefill-only"), (65, "prefill+decode")):
    sp = SamplingParams(max_tokens=n, temperature=0.0, ignore_eos=True)
    torch.cuda.nvtx.range_push(label)
    llm.generate([prompt], sp, use_tqdm=False)
    torch.cuda.synchronize()
    torch.cuda.nvtx.range_pop()
The kernel summaries, trimmed to the top lines and converted to milliseconds:
prefill only (2,048 tokens)
Time (%)  Total (ms)  Instances  Avg (ms)  Name
    42.9       176.7         36     4.908  nvjet_sm121_tst_mma_128x208x64_...
    38.1       156.7        108     1.451  nvjet_sm121_tst_mma_192x144x64_...
     5.3        21.6         36     0.601  triton_poi_fused_mul_silu_slice_1
     5.2        21.3         36     0.593  flash::flash_fwd_splitkv_kernel<...>
     3.0        12.2         36     0.338  triton_red_fused_fused_add_rms_norm_2

prefill + 64 decode steps
Time (%)  Total (ms)  Instances  Avg (ms)  Name
    66.7      3450.6       4673     0.738  internal::gemvx::kernel<...>
    22.7      1173.0       4608     0.255  internal::gemvx::kernel<...>
     3.5       179.3         36     4.982  nvjet_sm121_tst_mma_128x208x64_...
     3.0       157.7        108     1.460  nvjet_sm121_tst_mma_192x144x64_...
     2.0       103.5       2304     0.045  flash::flash_fwd_splitkv_kernel<...>
The names say it. The nvjet_..._mma kernels are cuBLAS's tensor-core matrix multiplications; there are 144 of them in prefill, four per block (the attention input and output projections, gate/up, down) over 36 blocks. In decode, the same layers run as gemvx, cuBLAS's matrix-vector kernel: 145 per step, the same 144 plus the output layer.
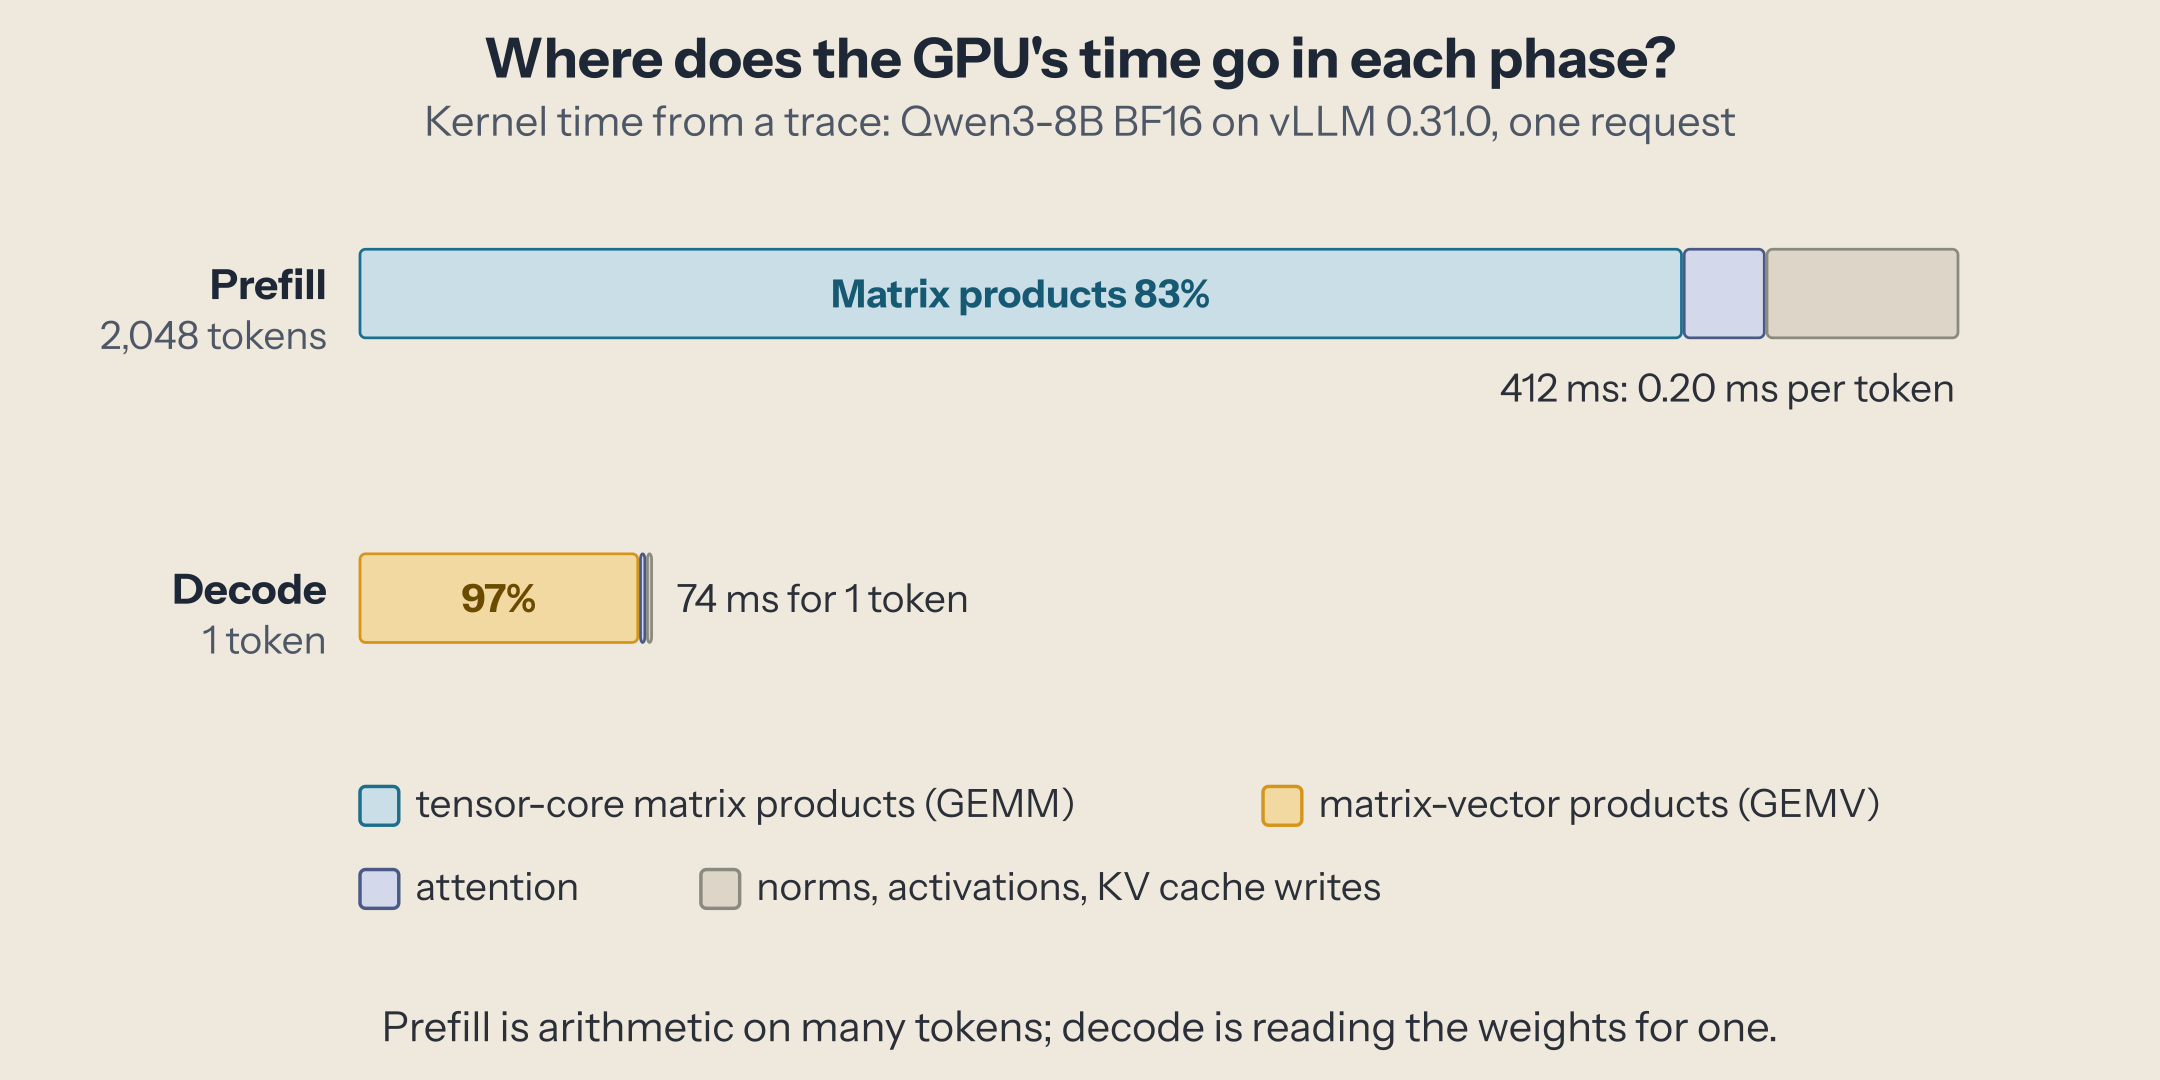
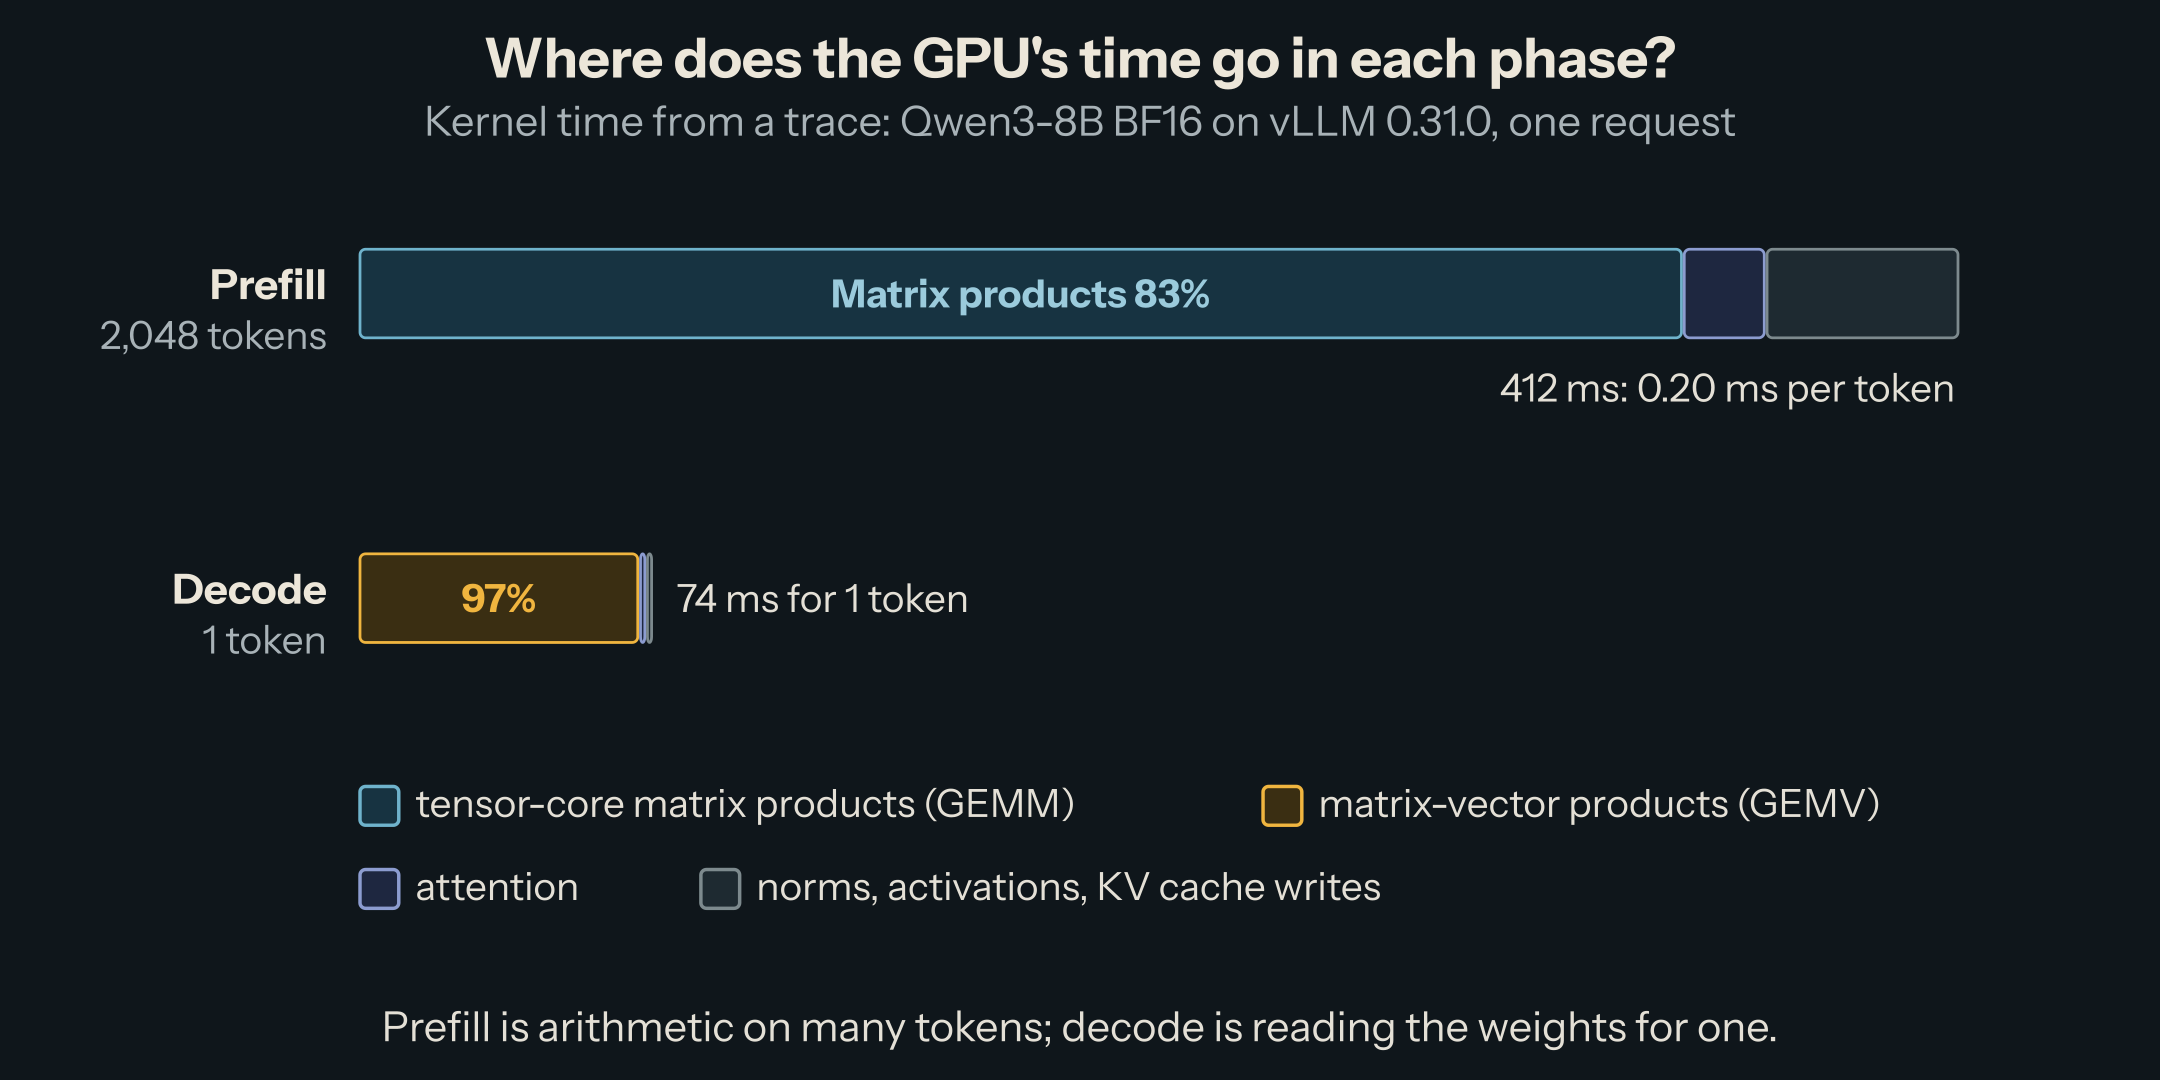
| Prefill pass (2,048 tokens) | Decode step (1 token) | |
|---|---|---|
| Kernel time | 412 ms | 74 ms |
| Linear layers | 333 ms of tensor-core GEMM, plus 7 ms for the output layer | 72.1 ms of GEMV |
| Attention | 21 ms | 1.8 ms |
| Everything else (norms, activations, KV cache writes) | 50 ms | 0.4 ms |
| Time per token | 0.20 ms | 74 ms |
Two numbers show which limit each phase hits.
- Prefill runs at 85 TFLOPS. The linear layers of the 36 blocks hold 6.95 billion parameters; 2,048 tokens through them is 2 × 2,048 × 6.95 billion = 28.5 trillion operations, done in 333 ms. The largest BF16 matrix multiplication we could run on this GPU reached 94 TFLOPS (measured here): prefill's matrix products run at 91% of the arithmetic peak.
- Decode reads at 210 GB/s. Each step reads the 13.9 GB of the blocks' linear layers plus the 1.24 GB output layer, 15.1 GB in 72.1 ms. The best plain memory read on this GPU reached 241 GB/s: decode's matrix-vector products run at 87% of the memory peak.
Each phase is close to its own ceiling, and the ceilings are different: arithmetic for prefill, memory for decode. Per token, prefill needs 2 × 6.95 billion = 13.9 billion operations, 0.16 ms at 85 TFLOPS; a decode step needs the whole 15.1 GB, 72 ms at 210 GB/s. That ratio is the gap between 0.20 and 74 ms (the rest of the prefill time is attention and the smaller kernels).
You can redo this for any GPU and dense model with two lines:
prefill time ≈ 2 × prompt tokens × parameters / matmul FLOPS
decode step  ≈ bytes of weights (+ KV cache read) / memory bandwidth
Below a few hundred prompt tokens (about 340 on this GPU, the ratio of its two peaks), the first line gives less than the second: a short prompt costs one weight read, like a decode step. That is why a 43-token prompt took 77 ms, about the same as one answer token.
The trace also settles where decode's time goes beyond the ideal read. The roofline piece predicted 63 ms per step at the full 241 GB/s and measured 73 ms. Here the GPU's kernel time (74.3 ms per step) matches the wall time (74.4 ms): with CUDA graphs, launching kernels costs almost nothing, and the gap is inside the GEMV kernels themselves, which read at 87% of the peak, not 100%.
The output layer runs once in prefill, not 2,048 times. Turning a position into scores over the 151,936-token vocabulary is only needed where a token will be sampled, so vLLM computes logits only at the last position of each request (source). That one product, a GEMV, took 7 ms. Attention is small at this length. In decode, each step reads the 2,048 tokens of KV cache (144 KiB per token for Qwen3-8B, sized here): 302 MB in 1.8 ms. It grows with the context and with every request in the batch, which is where decode's cost moves once contexts get long.
What moves which phase
Because the two phases have different limits, a change to the workload or the setup usually helps one and not the other.
| Change | Prefill | Decode |
|---|---|---|
| Longer prompt | More time, roughly in proportion (attention grows faster at long lengths) | Each step reads a bigger KV cache: at 32k tokens, 4.8 GB on top of 15.1 GB of weights, about a third slower per step |
| Longer answer | No change | One more step per token |
| More requests at once | No gain for long prompts, already limited by arithmetic; short prompts share weight reads like decode | Nearly free at first: one weight read serves every request (68 to 78 ms per step from 1 to 32 requests) |
| 4-bit weights | Faster only with 4-bit tensor cores | Fewer bytes per step: 2.7× faster with NVFP4 |
| FP8 KV cache | Small effect | Halves the cache bytes each step reads |
| Speculative decoding | No effect | Several tokens per weight read |
| Prefix caching | Skips the tokens already cached | No effect |
The pattern behind the table: decode wins when there are fewer bytes to read or more work per byte read, prefill wins when there is less arithmetic or faster arithmetic.
Why engines care
A server runs both phases at once, for different requests, and they get in each other's way. vLLM's scheduler puts prompt tokens and decode tokens into the same step whenever its token budget allows. A step that carries a 2,048-token prompt lasts as long as that prompt's prefill, so every request that is decoding waits that long for its next token.
Engines handle this in two ways:
- Chunked prefill cuts long prompts into pieces that fit a token budget per step, so decode tokens keep flowing between chunks. In that piece, the worst gap between two tokens of a running answer fell from 7.6 s to 0.22 s.
- Disaggregated serving puts prefill and decode on different GPUs, each sized and tuned for its own limit, and ships the KV cache between them.
Gotchas
The token budget chunks your prompts. vllm serve defaults --max-num-batched-tokens to 2,048 on GPUs below 70 GiB, 8,192 from 70 GiB and 16,384 from 160 GiB; the offline LLM class used for this trace gets larger defaults (source). The GB10 lands in the smallest tier under vllm serve despite its 121 GiB, because the memory query vLLM uses isn't supported on it. Under a 2,048 budget, a 10,000-token prompt runs as five prefill steps, each one reading the weights again and sharing its step with every request that is decoding. Check the value your server uses before you tune anything else; we set 8,192 for the trace so the result didn't depend on the machine.
One "tokens per second" number hides two workloads. A benchmark that reports total throughput mixes 0.2-ms prompt tokens with 74-ms answer tokens, and its result mostly reflects the prompt-to-answer ratio of the test. vLLM's own log keeps them apart (Avg prompt throughput and Avg generation throughput); do the same.
Short prompts don't behave like prefill. A benchmark of "prefill speed" with 50-token prompts measures the weight read, not the arithmetic: per-token prefill speed only shows up once prompts reach a few hundred tokens.
Besides the weights, decode reads the KV cache, and the cache's size decides how many requests can share each weight read: the KV cache, sized puts a number on it for any model.
This post is part of the How an LLM Request Becomes Tokens collection (2 of 10)

Inference engineering and AI in production — depth-first, no hype.
Inference Notes
Once a week: what changed in serving AI models, and what it means if you build, run or pay for them, in about five minutes.
Related Articles
From Prompt to Token: The Life of an LLM Request
One chat request followed through a real inference server, from chat template and tokens to prefill, decode, sampling, and streaming, each stage timed.
A GPU in One Picture: SMs, Warps, and Memory
The parts of a GPU that decide inference speed, from streaming multiprocessors to DRAM, with one real GPU's numbers and three measurements.
DeepGEMM: The Matrix Multiplications Behind DeepSeek's Models
What DeepGEMM computes for DeepSeek's models: block-scaled FP8 and FP4 matrix multiplications, grouped GEMMs for MoE experts, and the fused Mega MoE kernel.