Benchmark an Inference Server Without Lying to Yourself
A benchmark is a model of your traffic, and the server answers whatever question it is asked. Send it the same prompts twice and it measures its cache; send everything at once and it measures its queue; cap the requests in flight and it never looks overloaded. We took one vLLM server and made each common mistake on purpose, next to the run done right, so each rule below comes with how far it moved the numbers. The metrics themselves (TTFT, TPOT, ITL, goodput) are defined in TTFT, ITL, goodput.
The setup
One NVIDIA GB10, vLLM 0.31.0 serving Qwen3-8B in BF16 with its default scheduler (prefix caching and chunked prefill on), and vLLM's own load generator:
$ vllm serve Qwen/Qwen3-8B --gpu-memory-utilization 0.70 --max-model-len 32768
$ vllm bench serve --backend vllm --model Qwen/Qwen3-8B --dataset-name random \
    --random-input-len 1024 --random-output-len 256 --random-range-ratio 0 --ignore-eos \
    --num-prompts 120 --request-rate 2 --seed 21 \
    --percentile-metrics ttft,tpot,itl,e2el --metric-percentiles 50,90,99 \
    --goodput ttft:1000 tpot:100 --save-result --save-detailed
Every run below changes one thing from that. No request failed in any run, and the host never ran short of memory.
Mistake 1: sending the same prompts again
--seed picks the random prompts. (TTFT, ITL, goodput warns about this; here is its size.) Run a benchmark twice with the same seed and the second run sends exactly the same prompts. The server's prefix cache recognizes them: in our second run, 1,008 of every 1,024 prompt tokens came from the cache (63 of its 64 blocks of 16: the engine always recomputes at least the last token to get its logits, so the last block is never a hit), and the server only computed the rest.
| Same 60 requests at 1 per second | Median TTFT | p99 TTFT | Median TPOT | Goodput (1 s / 100 ms) |
|---|---|---|---|---|
| First time | 420 ms | 970 ms | 104 ms | 0.25 req/s |
| Same seed again | 231 ms | 305 ms | 86 ms | 0.74 req/s |
The repeat looks 45% faster to the first token and three times better on goodput, and none of it is the server getting faster. It happens across load points too: a sweep that reuses one seed sends each point the previous point's prompts. Give every run its own seed. If your real traffic does share prefixes (a long system prompt, an agent's history), model that on purpose with a shared prefix of the right length (--random-prefix-len), not by accident.
Mistake 2: reporting the burst as capacity
--request-rate inf sends all requests at once. It gives the biggest throughput number a server can produce, and the number vendors like to quote:
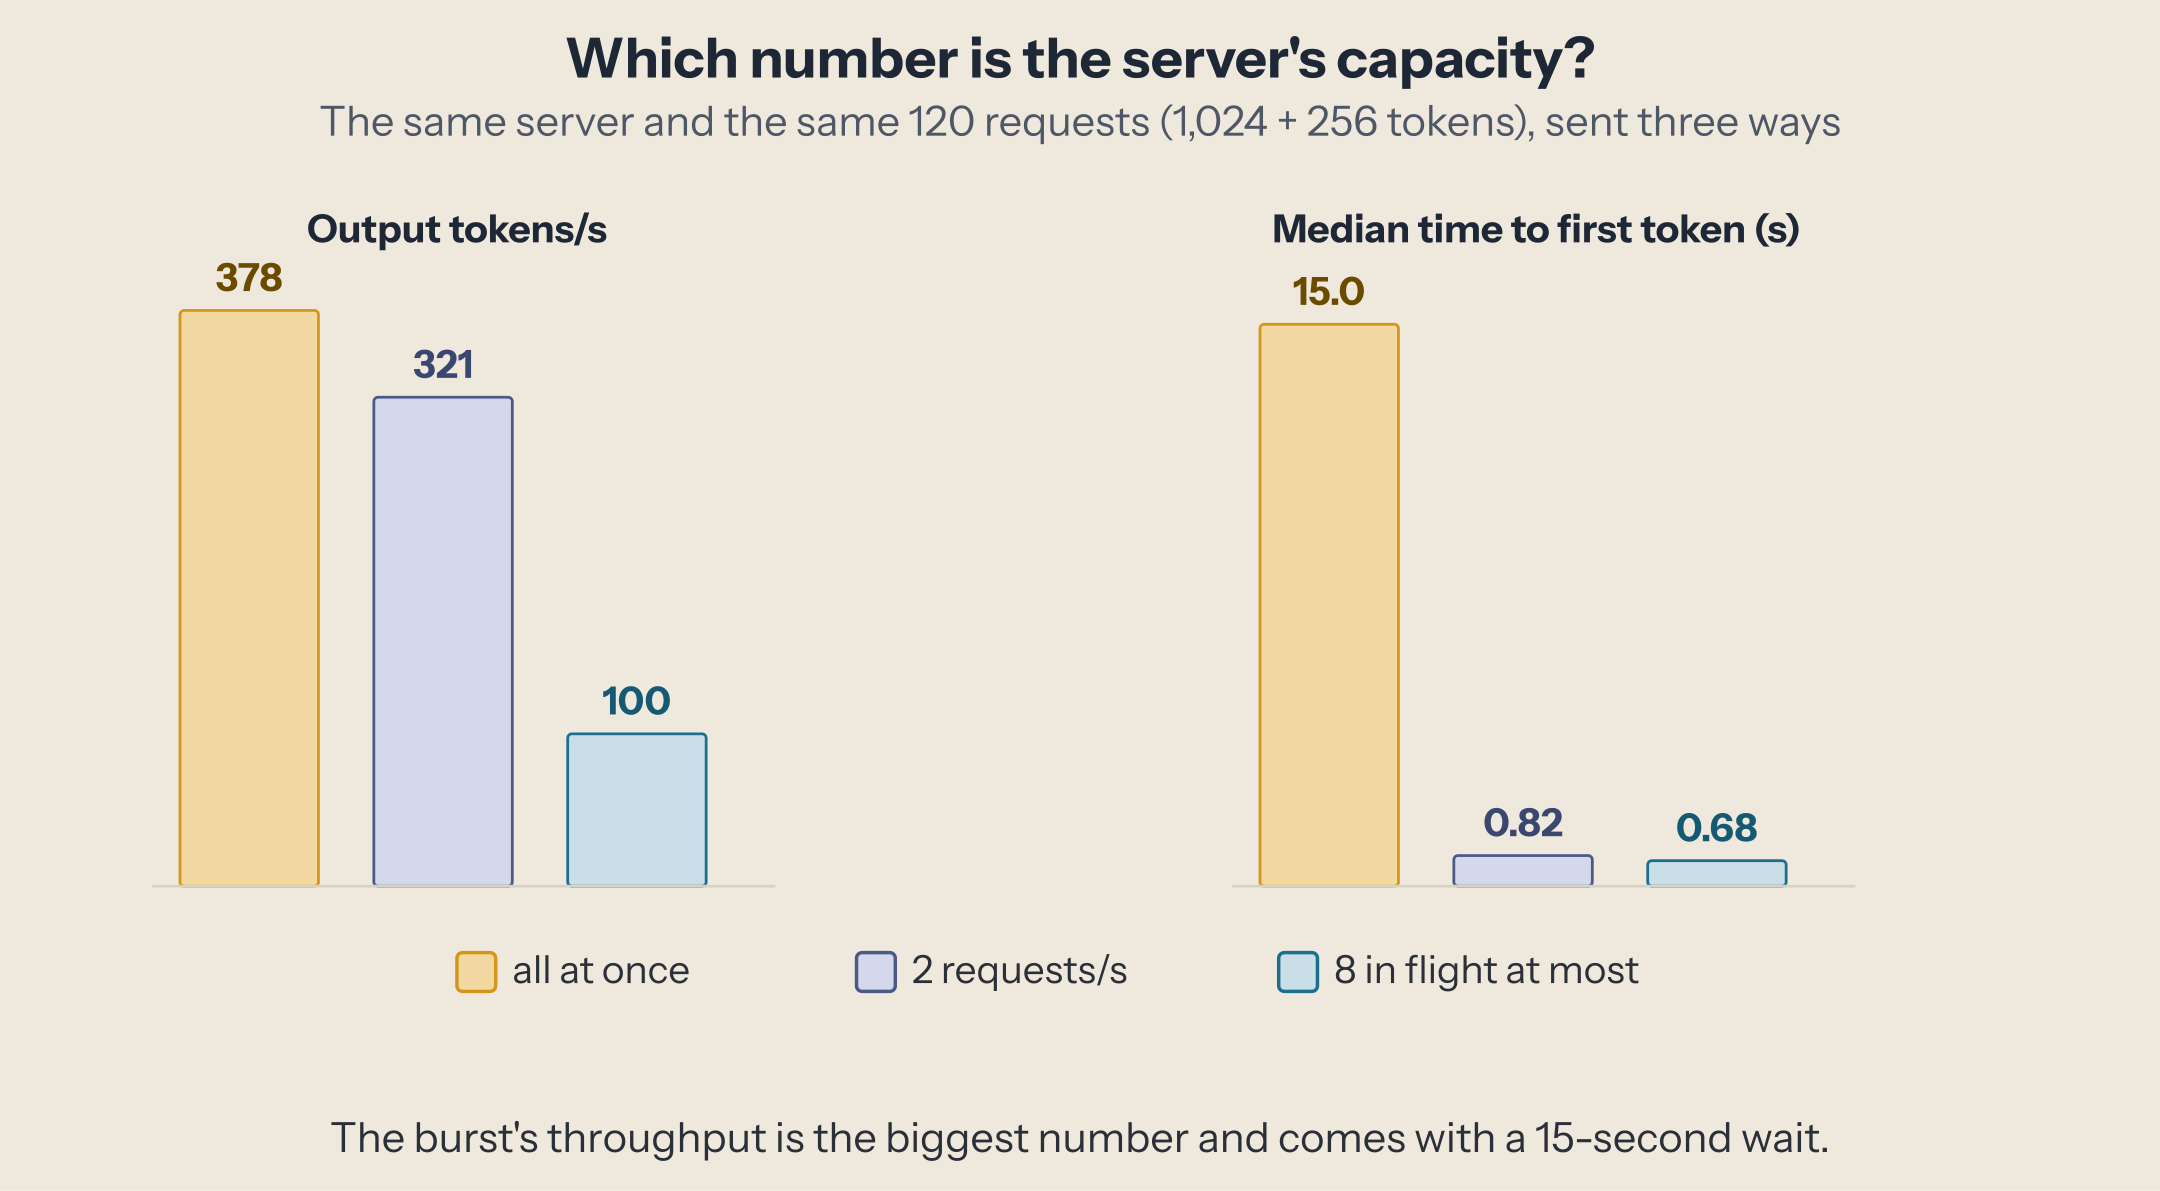
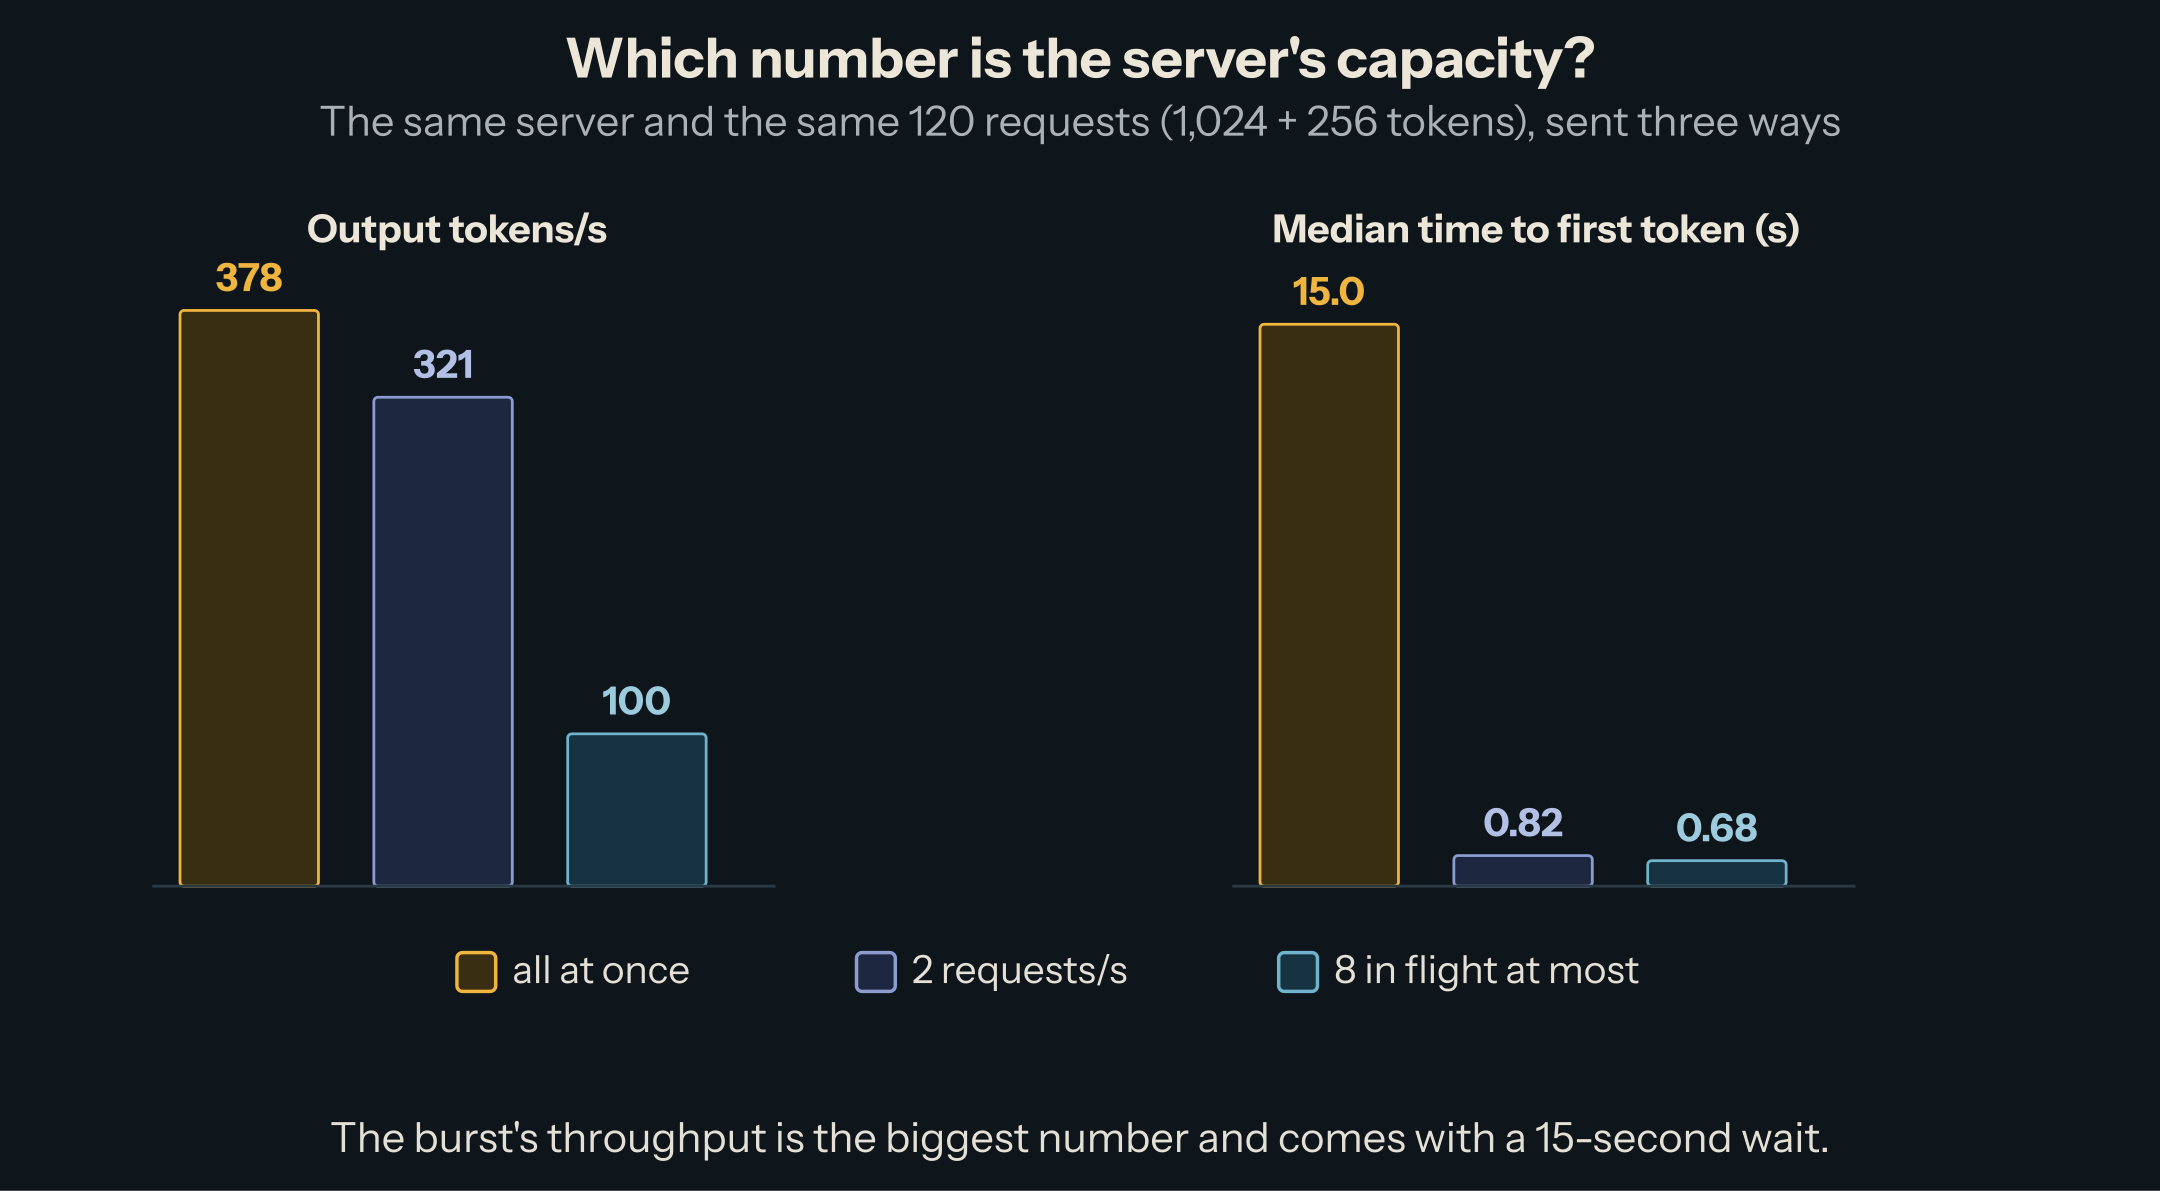
All at once, the server produced 378 tokens/s, 18% more than at 2 requests per second, because all 120 requests were in the batch at once (108 at most at 2 requests per second). The price was a median wait of 15 s for the first token and 36 s at the 99th percentile: every request queued behind the others. That throughput is a ceiling, not a capacity. A service has a latency target; capacity is the highest load that still meets it, which is what goodput measures.
Mistake 3: a concurrency cap instead of arrivals
--max-concurrency 8 with no rate keeps exactly 8 requests in flight: a new one starts only when one finishes. That is a closed loop, 8 patient users who never send a request while waiting. The server is never overloaded by construction: median TPOT 77 ms and median TTFT 0.68 s, against 212 ms and 0.82 s at 2 requests per second. The waiting moved to the client: vllm bench serve records it as queue_times in the result file (--percentile-metrics client_queue_time reports it), and here a request waited 143 s on average before it was sent, which no TTFT includes. Real users arrive independently of how busy the server is, which --request-rate models (Poisson arrivals at that average rate). A closed-loop test answers "how fast are 8 users served", which is useful, but it cannot show what happens when demand exceeds the server, which is the question a capacity plan asks.
At 2 requests per second this server was past its limit: TPOT more than doubled against 1 request per second, no request met the 1 s / 100 ms target (goodput was zero in all three runs), and TTFT kept growing during the run: a median of 0.4–0.6 s for the first quarter of arrivals, 1.6–2.1 s for the last. A load point where TTFT climbs from the start of the run to its end is past saturation, because the queue grows faster than the server drains it; at 1 request per second, TTFT stayed flat.
Mistake 4: one run
We ran the 2-requests-per-second benchmark three times, changing only the seed:
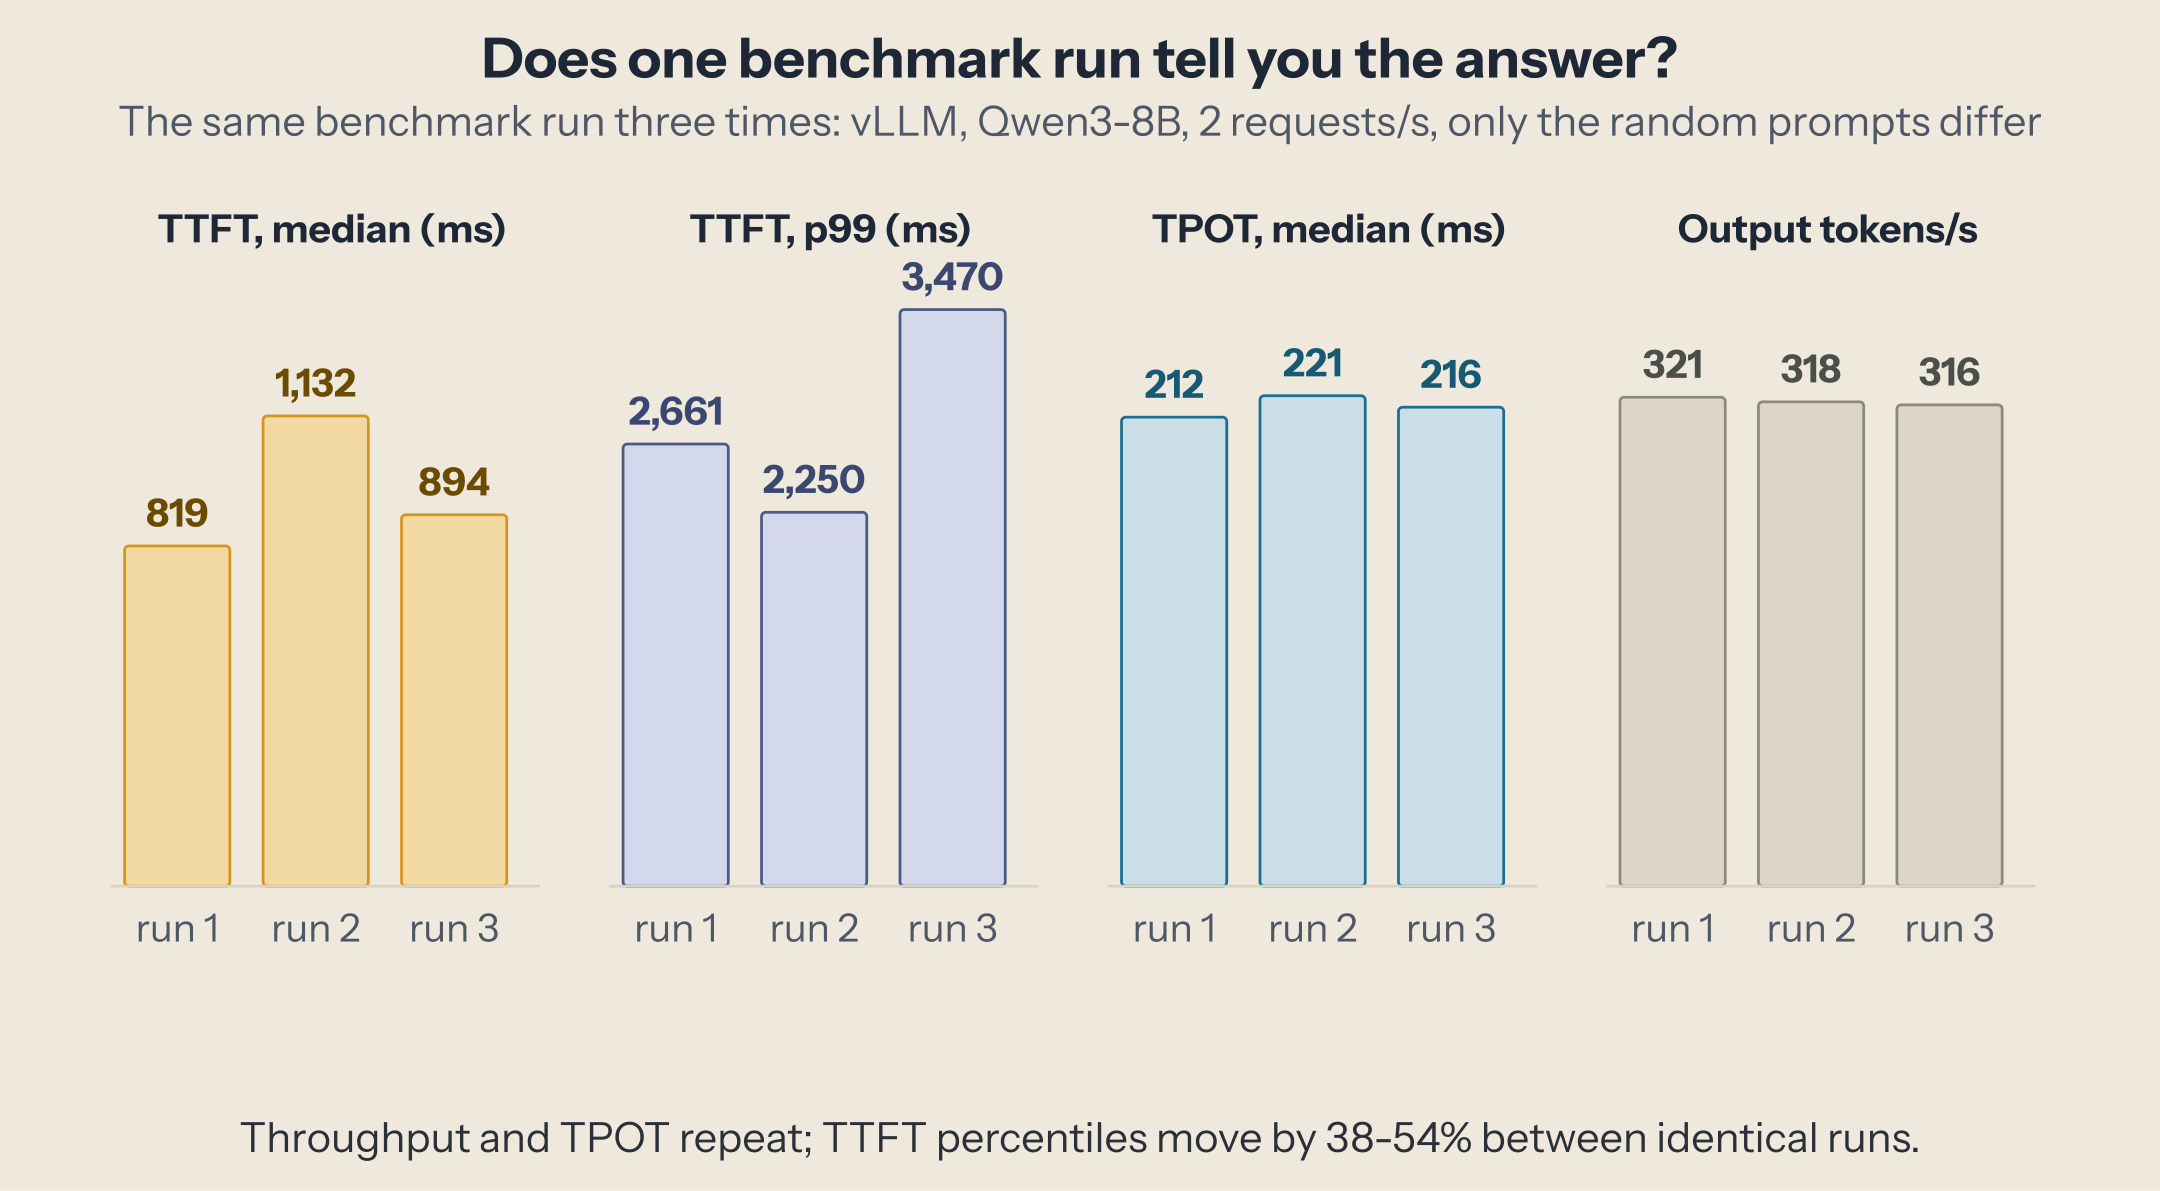
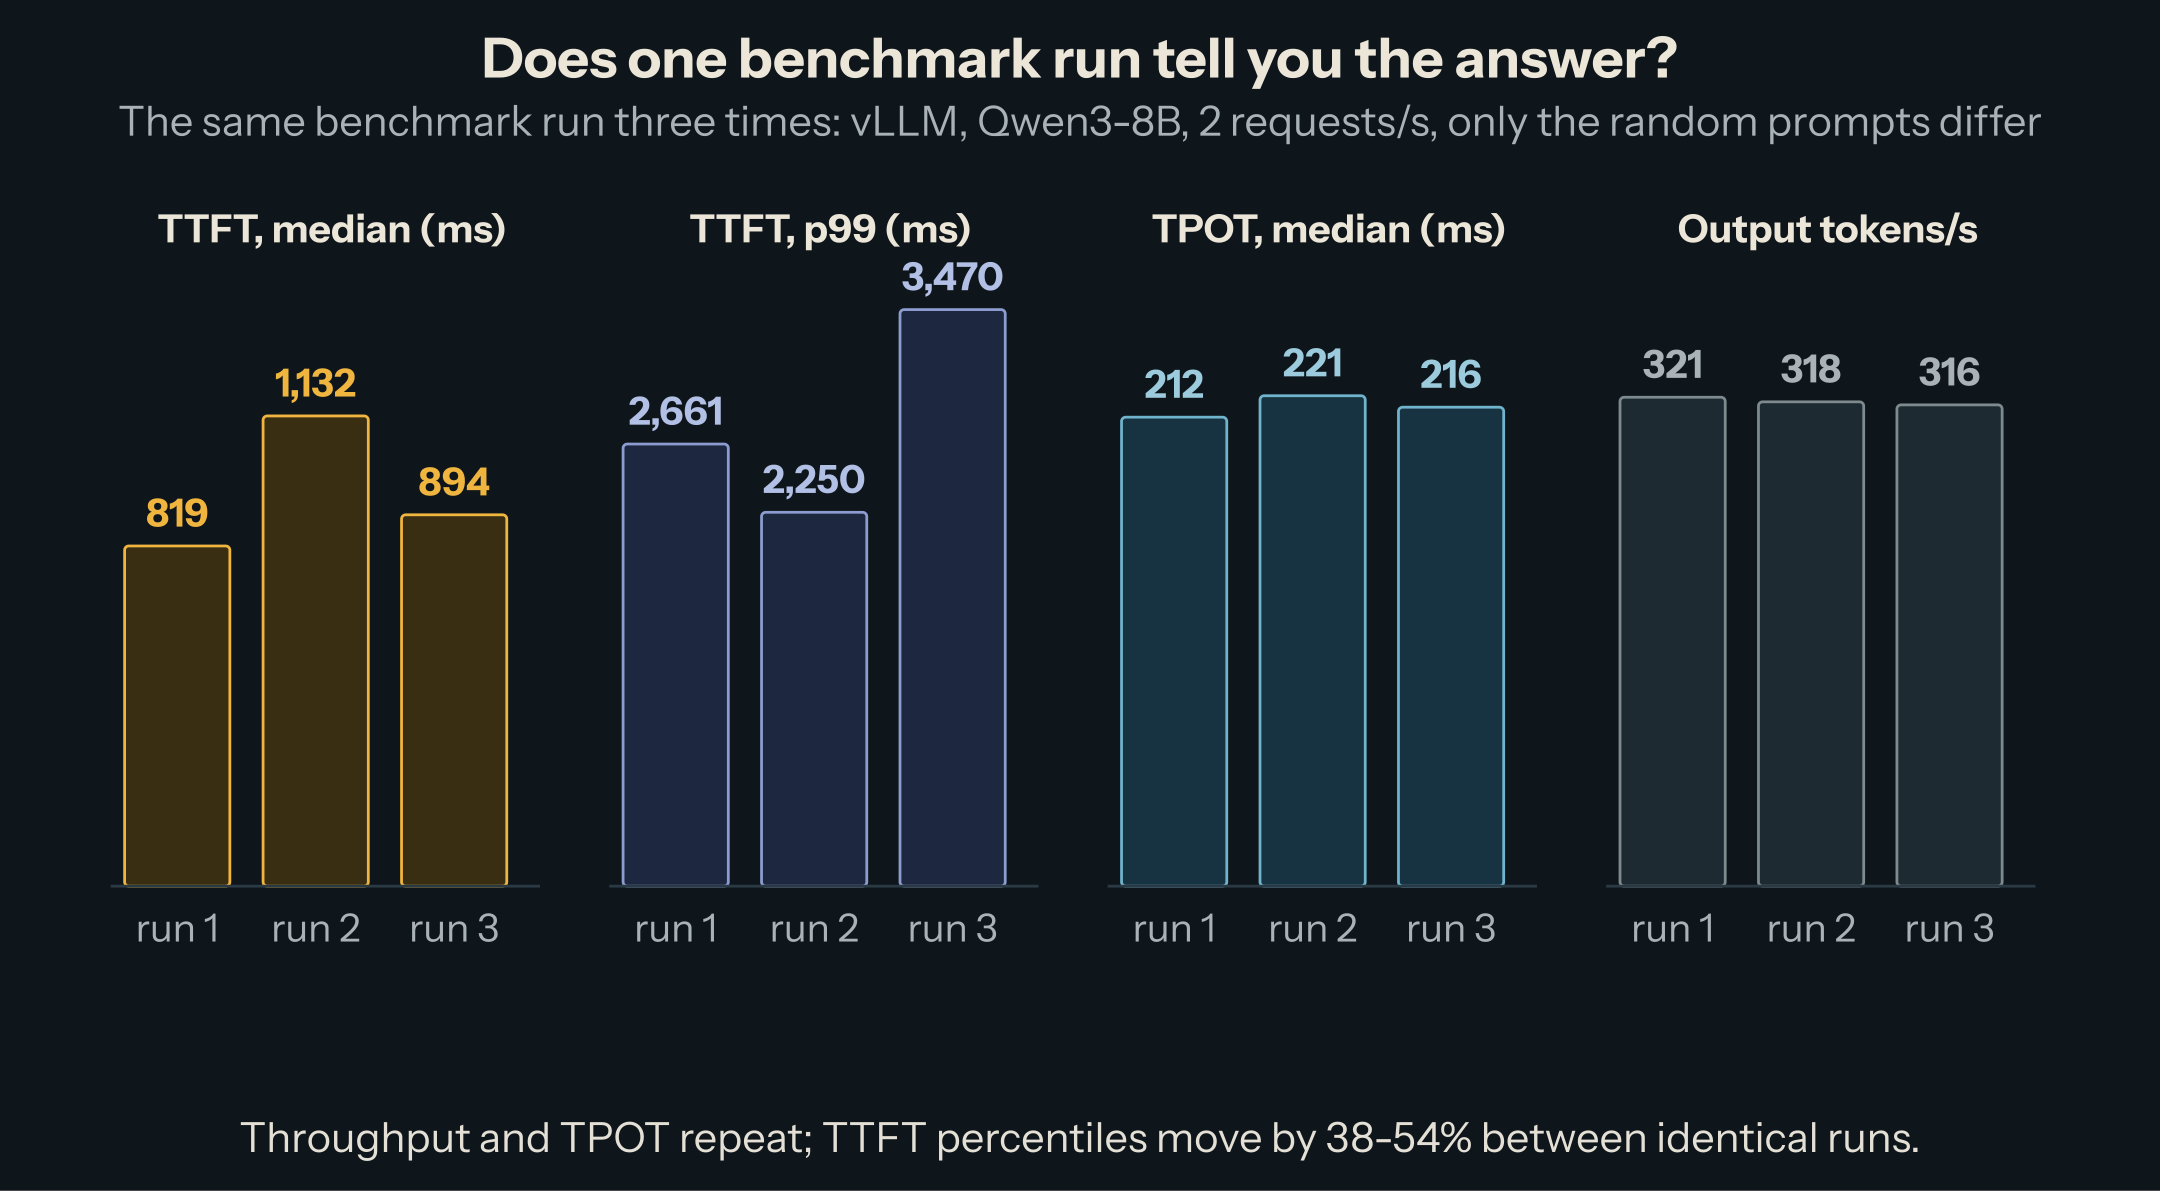
Throughput and TPOT repeated within 2% and 5%. TTFT did not: the median moved by 38% and the p99 by 54% between runs that differ only in which random prompts arrived when. Near saturation, TTFT depends on how many requests happen to arrive close together, and 120 requests is a small sample of that. A 30% TTFT improvement measured in one run against one run of the baseline is inside this spread. Run each configuration at least three times with different seeds, report the spread, and make each run long enough (several minutes per load point) that its percentiles rest on hundreds of requests.
Mistake 5: every request the same length
--random-range-ratio 0 makes every prompt exactly 1,024 tokens and every answer 256. That makes runs comparable, but traffic is not like that. With lengths spread ±90% around the same means, the p99 TPOT rose to 291 ms, above the 240-250 ms of all three fixed-length runs (one run, so a direction rather than a size): long prompts stall the steps they share, and a short answer averages those stalls over few tokens; the four worst came from answers of 31 to 117 tokens. Medians stayed within the run-to-run spread. Use fixed lengths to compare configurations, and replay your real length distribution (--dataset-name custom or a sample of logged requests) before you commit to a latency target.
The server's view and the client's
vLLM exports the same latencies as Prometheus histograms on /metrics. Around one run, the server's mean TTFT was 1,001 ms against 1,012 ms measured by the client, on the same machine: the difference is the HTTP path, and in production it also includes the network and any gateway. Measure that offset once, then the server's metrics are a trustworthy live view.
One server metric misleads under load: the mean queue time was 13 ms while the mean TTFT was 1 s. vLLM's queue time stops when a request is first scheduled, and the scheduler admits new requests into the running batch while it has room (up to --max-num-seqs) and KV cache memory; here up to 113 ran at once. Overload shows up as slower steps and a longer prefill (799 ms on average, counted from first scheduling to first token), not as time in the queue. Watch TTFT and TPOT, not the queue alone.
Two things that did not matter here
A cold server. The first 32 requests after startup had the same TTFT and TPOT as 32 requests after a warm-up (median TTFT 404 against 385 ms, first request 240 ms against 239 ms). vLLM 0.31.0 compiles and captures its CUDA graphs before it reports ready; startup took 1 min 47 s, mostly loading weights (71 s) and capturing graphs (17 s). A warm-up costs little and protects you on engines that compile lazily, but on this one the first requests were already representative.
--ignore-eos. Without it, the answers still averaged exactly 256 tokens: random-token prompts don't lead the model to an end token within 256. The flag matters with real prompts, whose answers end on their own; with random ones, it changes nothing.
The checklist
- Measure on an idle machine, and check failed requests and host memory after every run.
- Give every run and every load point its own seed; model shared prefixes deliberately.
- Use
--request-rate(open loop) for capacity questions; keep--max-concurrencyfor "how fast are N users served". - Never report a burst (
--request-rate inf) as capacity; report goodput at your latency target. - Run each point at least three times, long enough for its percentiles, and report the spread.
- Compare configurations at fixed lengths; validate the target with your real length distribution.
- Reconcile client and server metrics once; then watch TTFT and TPOT on
/metrics, not queue time. - Write down the versions, flags and model of every run: a number without its setup cannot be compared.
This post is part of the Serving in Production collection (3 of 4)

Inference engineering and AI in production — depth-first, no hype.
Inference Notes
Once a week: what changed in serving AI models, and what it means if you build, run or pay for them, in about five minutes.
Related Articles
TTFT, ITL, Goodput: Measuring What Users Feel
What TTFT, TPOT, ITL, end-to-end latency, and goodput each measure, how the tools compute them, and why peak throughput is the wrong target.
Measuring the Damage: Evaluations That Catch Quantization Errors
GSM8K said every 4-bit format matched BF16. A noise baseline, paired comparisons, token-level KL, and a code benchmark showed which ones did not.
Expert Parallelism, and What DeepEP Does for It
Why serving a big MoE model means spreading its experts over many GPUs, what dispatch and combine cost, and how DeepEP and its V2 redesign make it fast.